-
Notifications
You must be signed in to change notification settings - Fork 3
/
README.Rmd
111 lines (84 loc) · 3.54 KB
/
README.Rmd
1
2
3
4
5
6
7
8
9
10
11
12
13
14
15
16
17
18
19
20
21
22
23
24
25
26
27
28
29
30
31
32
33
34
35
36
37
38
39
40
41
42
43
44
45
46
47
48
49
50
51
52
53
54
55
56
57
58
59
60
61
62
63
64
65
66
67
68
69
70
71
72
73
74
75
76
77
78
79
80
81
82
83
84
85
86
87
88
89
90
91
92
93
94
95
96
97
98
99
100
101
102
103
104
105
106
107
108
109
---
output: github_document
---
<!-- README.md is generated from README.Rmd. Please edit that file -->
```{r setup, include = FALSE}
knitr::opts_chunk$set(
collapse = TRUE,
comment = "#>",
fig.path = "man/figures/README-",
out.width = "100%"
)
```
## d3rain
[](https://travis-ci.org/daranzolin/d3rain)

According to the authorities at Urban Dictionary, ['drip' is synonymous with 'immense swag.'](https://www.urbandictionary.com/define.php?term=Drip) This package brings some D3 drip to R.
### Installation
You can install `d3rain` from GitHub via:
``` r
remotes::install_github("daranzolin/d3rain")
```
## Examples
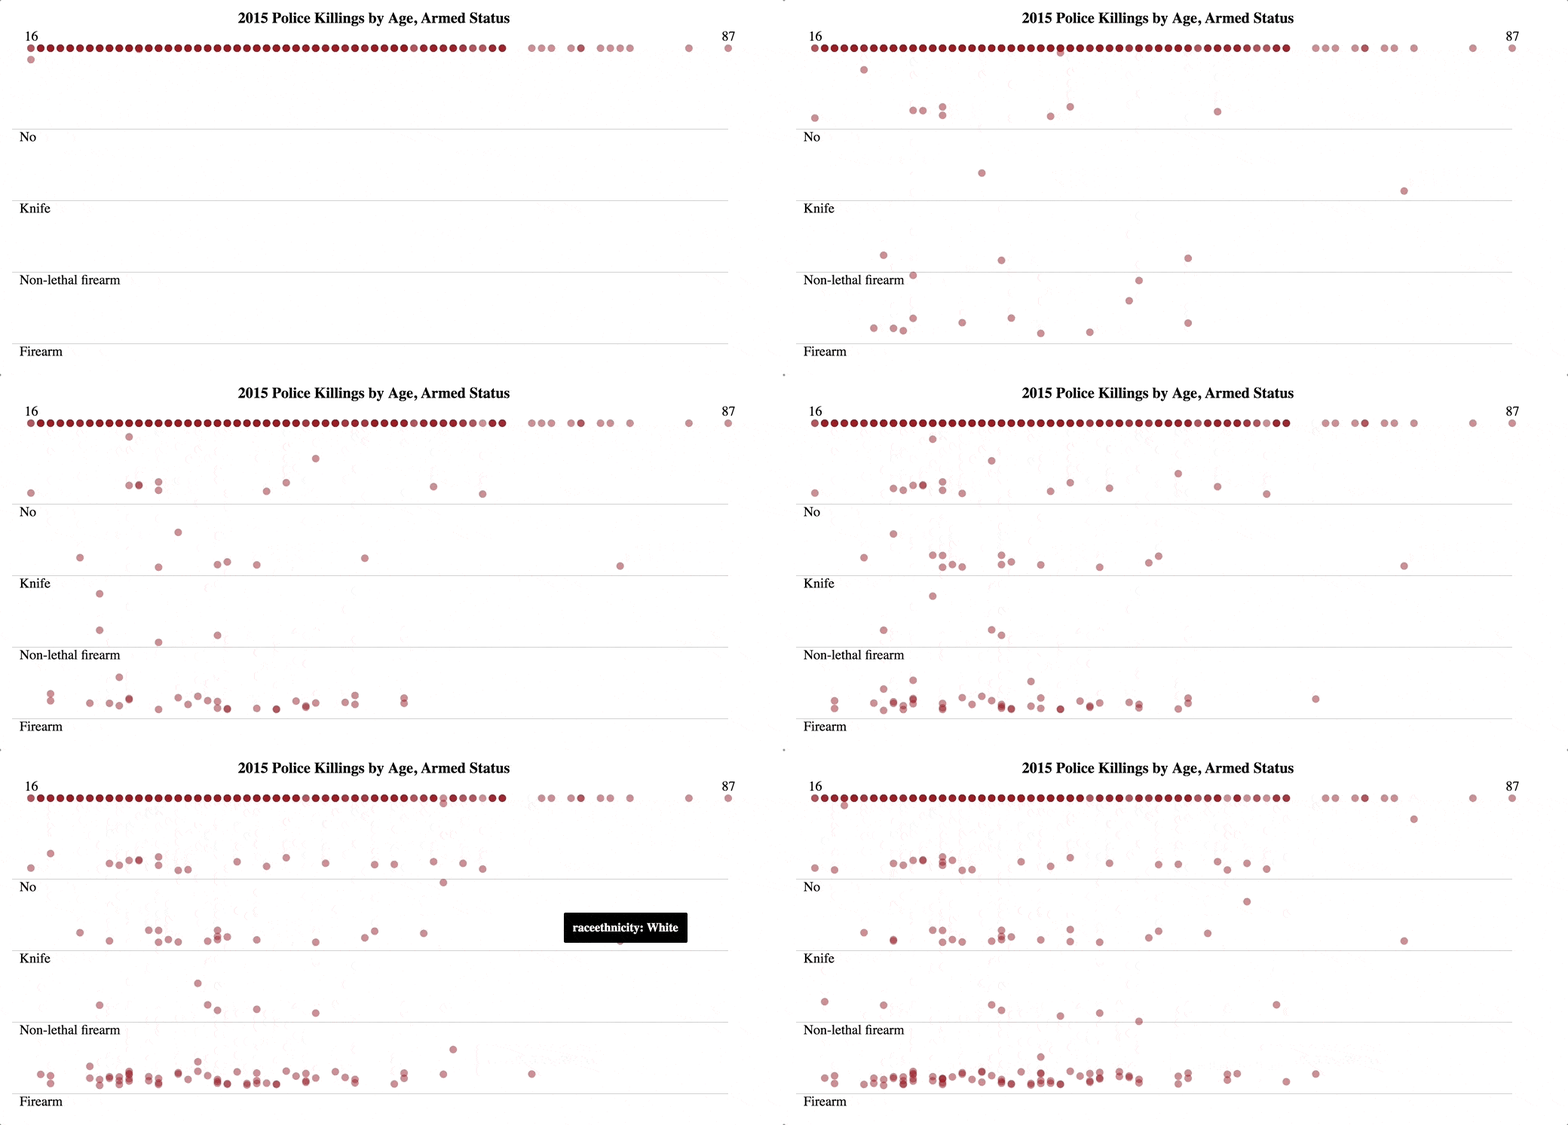
'Rain' visualizations are useful aids to observe the relationship between a ranked, numeric variable (e.g. percentile, rank, etc.) and any factored, categorical variable.
```{r eval=FALSE}
library(d3rain)
library(dplyr)
armed_levels <- c('No', 'Knife', 'Non-lethal firearm', 'Firearm')
pk <- fivethirtyeight::police_killings %>%
filter(armed %in% armed_levels,
!is.na(age)) %>%
mutate(armed = factor(armed, levels = armed_levels))
pk %>%
d3rain(age, armed, toolTip = raceethnicity, title = "2015 Police Killings by Age, Armed Status") %>%
drip_settings(dripSequence = 'iterate',
ease = 'bounce',
jitterWidth = 20,
dripSpeed = 1000,
dripFill = 'firebrick') %>%
chart_settings(fontFamily = 'times',
yAxisTickLocation = 'left')
```

`drip_settings` adjusts the drip sequence, easing animation, jitter width, drip speed, and color. `chart_settings` controls the axes displays, font size, font family, and background color.
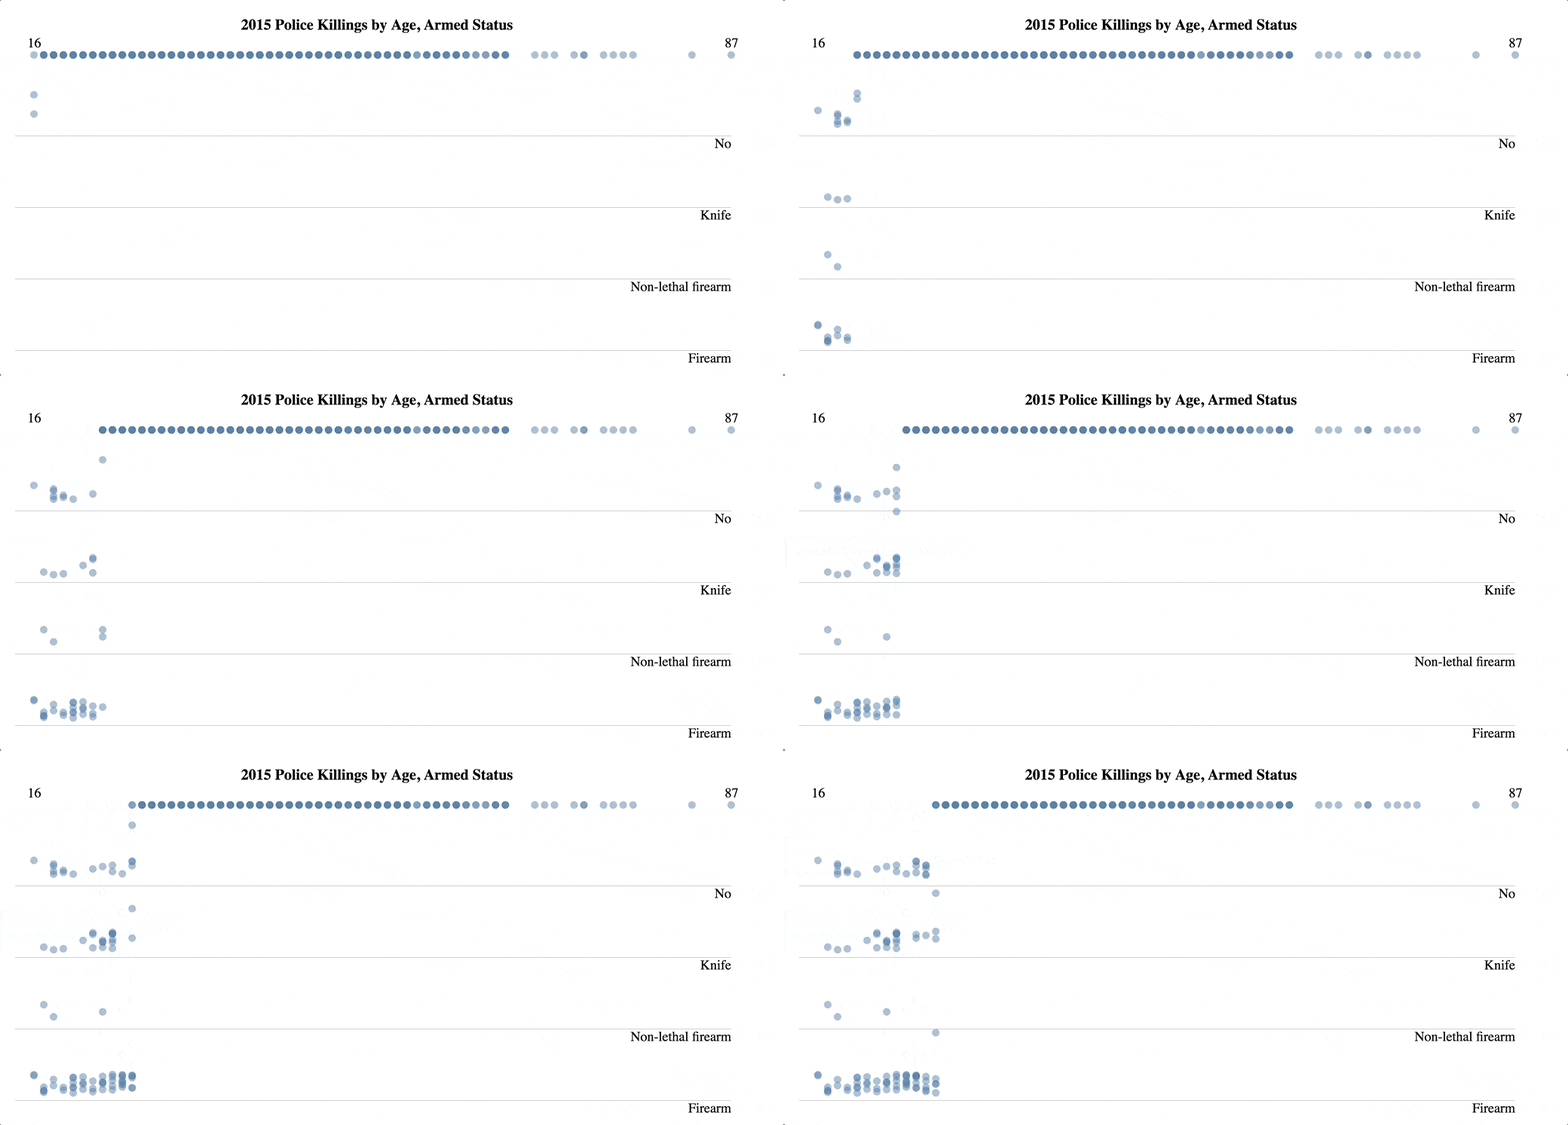
You can adjust the drip iteration by reordering the data frame:
```{r eval=FALSE}
pk %>%
arrange(age) %>%
d3rain(age, armed, toolTip = raceethnicity, title = "2015 Police Killings by Age, Armed Status") %>%
drip_settings(dripSequence = 'iterate',
ease = 'linear',
jitterWidth = 25,
dripSpeed = 500,
dripFill = 'steelblue') %>%
chart_settings(fontFamily = 'times',
yAxisTickLocation = 'left')
```

## Rain Histograms
Create rain histograms with `d3rain_hist` and the accompanying functions:
```{r eval = FALSE}
d <- readr::read_csv("https://raw.githubusercontent.com/babeheim/citation-gates/master/citation-data-simulated.csv") %>%
rename(Downloaded = downloaded,
Contacted = contacted,
Replied = reply_received,
Received = data_received) %>%
mutate(Total = TRUE,
`Downloaded and Received` = case_when(
Downloaded ~ TRUE,
Received ~ TRUE,
TRUE ~ FALSE)
)
d %>%
d3rain_hist(x = year,
levels = c("Total", "Contacted", "Replied", "Downloaded and Received"),
title = "Citation Statuses, 1960-2019") %>%
hist_chart_settings(annotations = c("Total Sample: 560", "475 (95%)", "309 (65%)", "147 (26%)"),
levelLabelLocation = "right") %>%
hist_drip_settings(colors = c("black", "forestgreen", "orange", "firebrick"),
transitionIntervals = 2500,
dripSpeed = 300)
```
## Future Work
* Additional drip behaviors (e.g. by group)
* Conditional fill colors