-
-
Notifications
You must be signed in to change notification settings - Fork 444
Screenshots
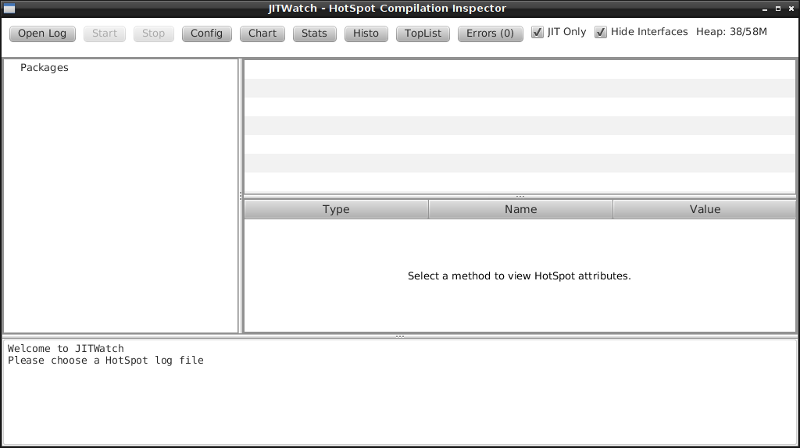
Main JITWatch application window.
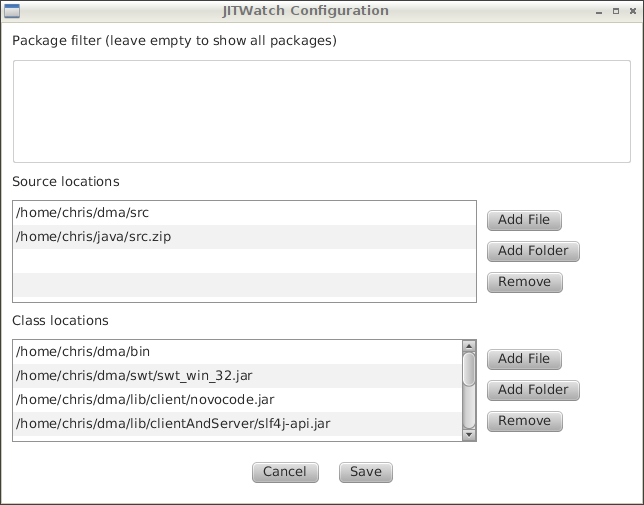
Configure JITWatch by mounting src trees, class folders, and jars.
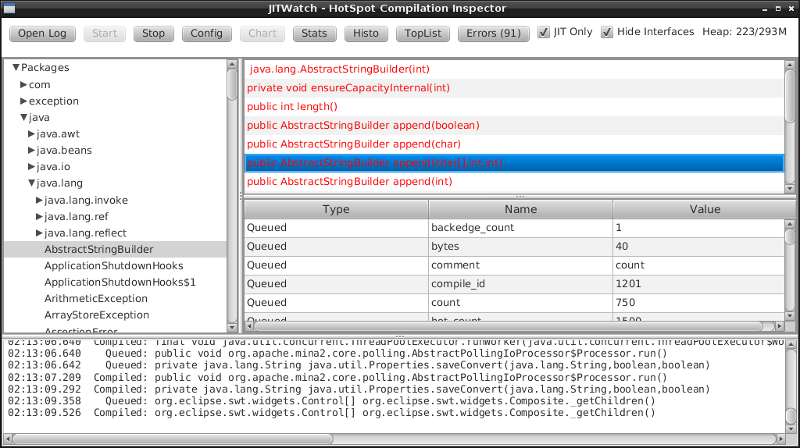
Browse the package tree and inspect methods.
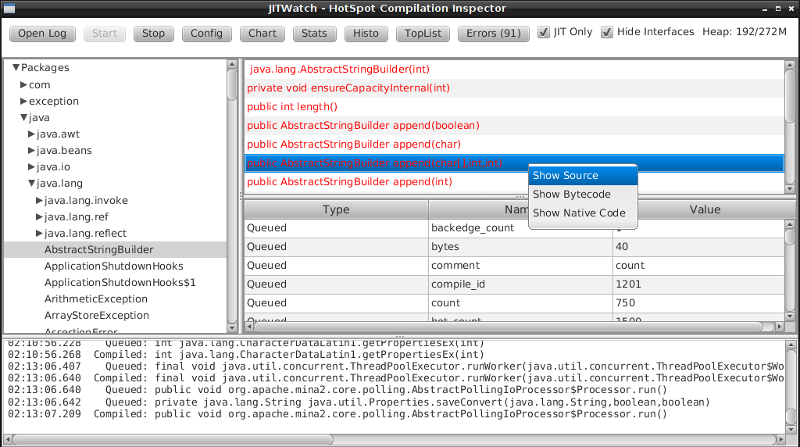
Right click a method to show detailed inspection tools
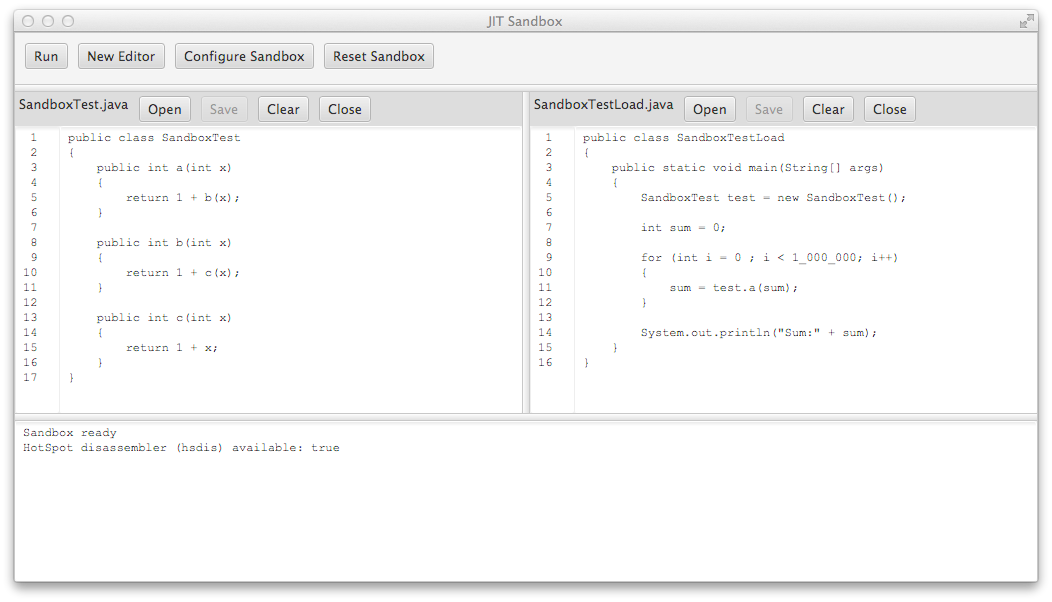
JIT Sandbox: Edit->Compile->Execute->Analyse fast feedback loop.
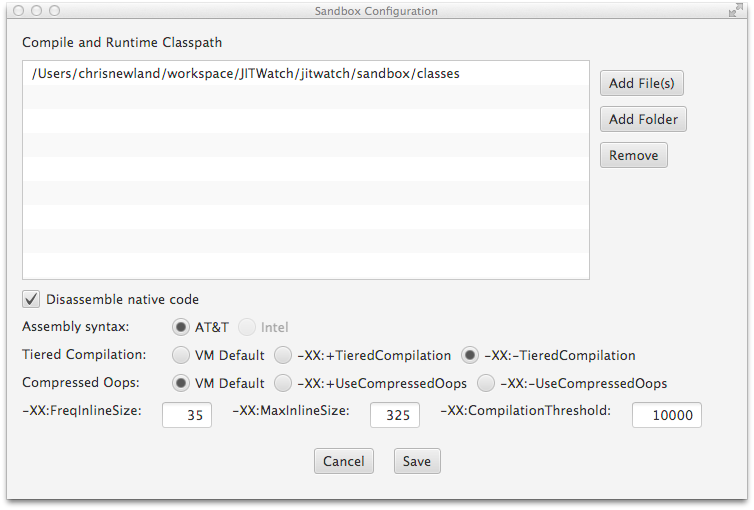
JIT Sandbox: Experiment with various HotSpot JIT Compilation options.
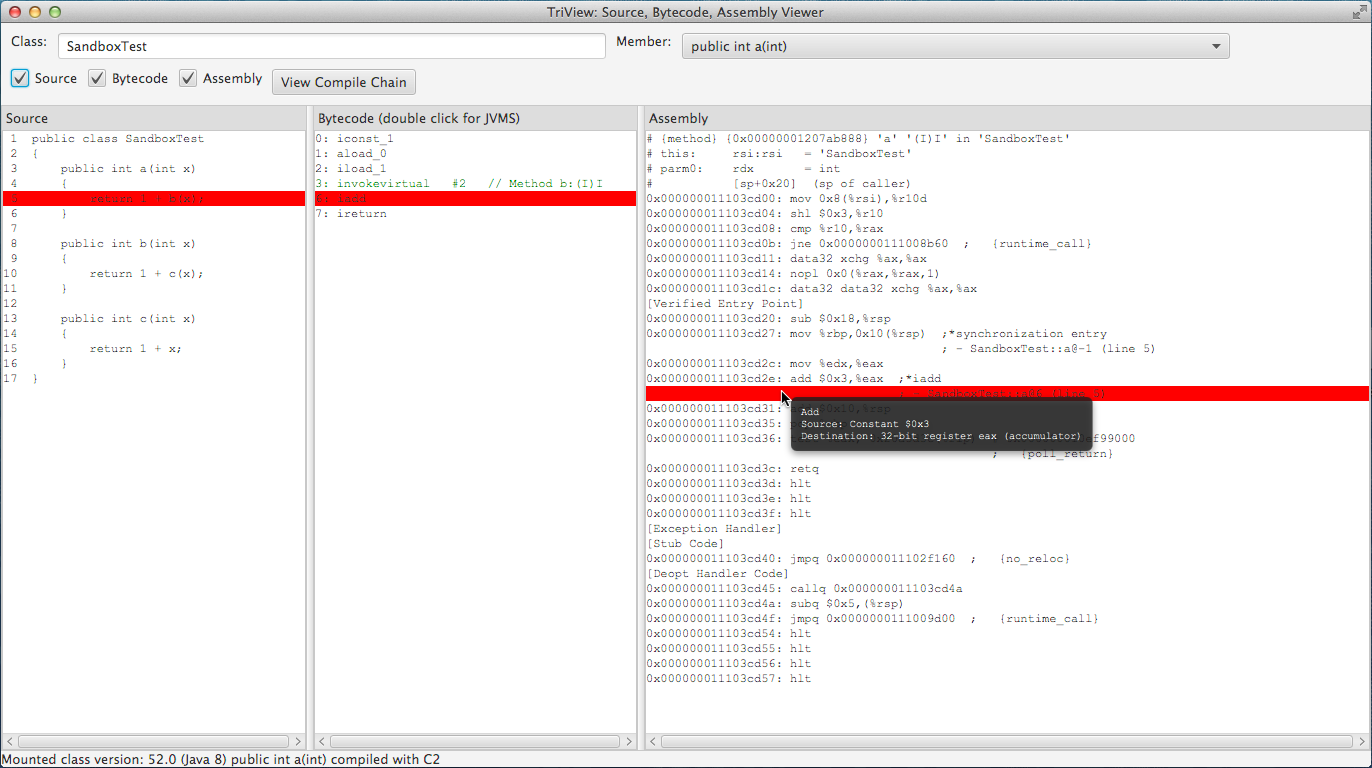
TriView combined source, bytecode, assembly viewer.
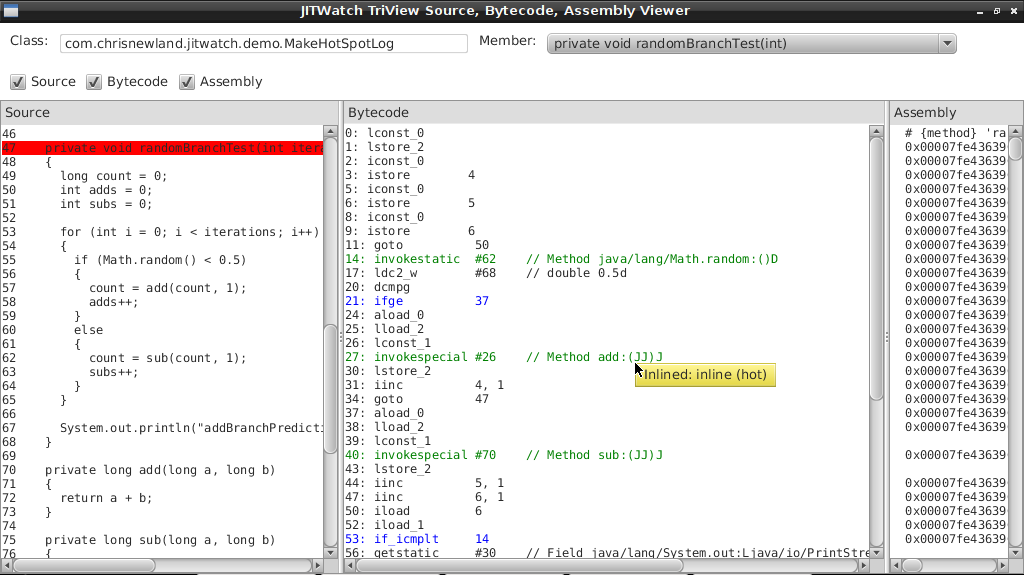
Bytecode annotations for inlining and branch taken probability.
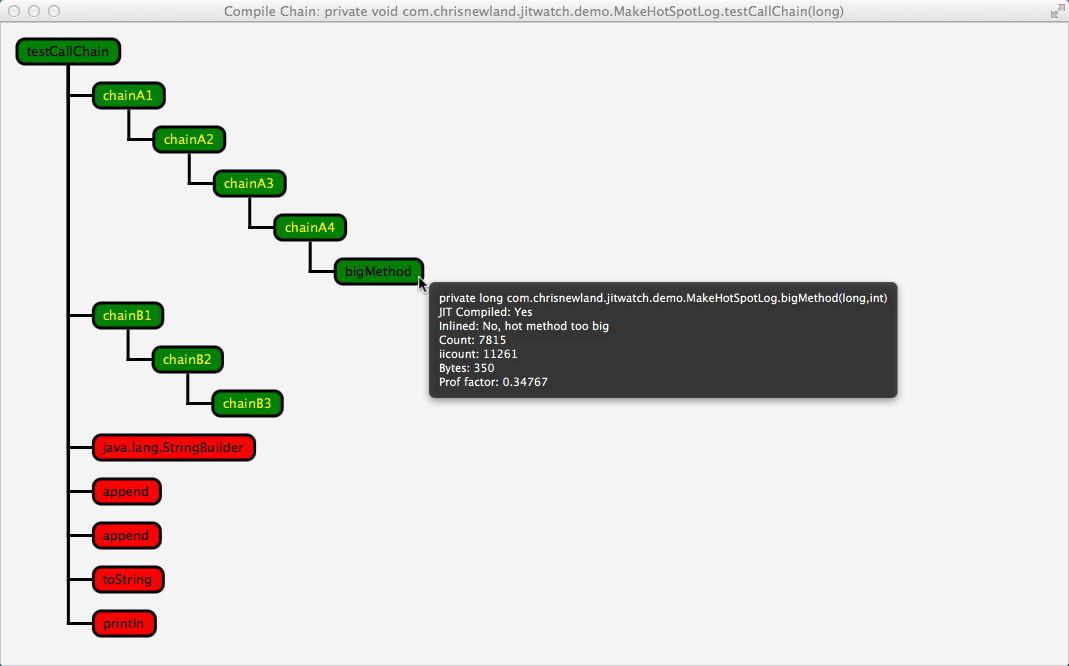
Compile Chain showing JIT-compiled and inlined members.
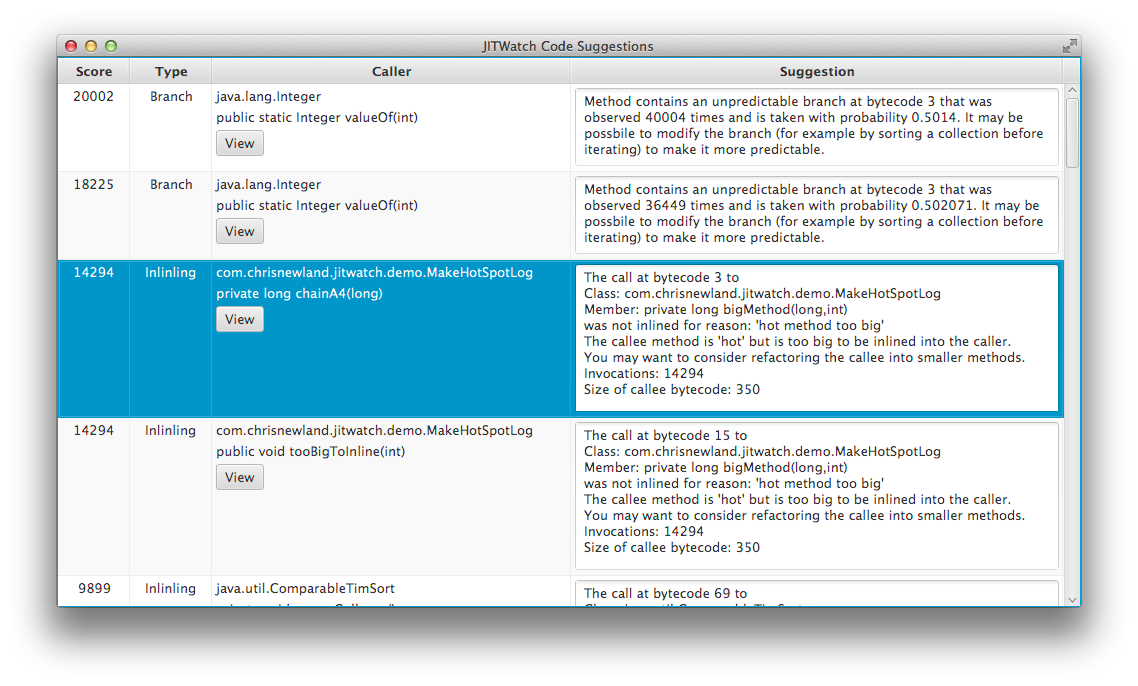
Suggestion tool - highlights hot method inlining failures and unpredictable branches.
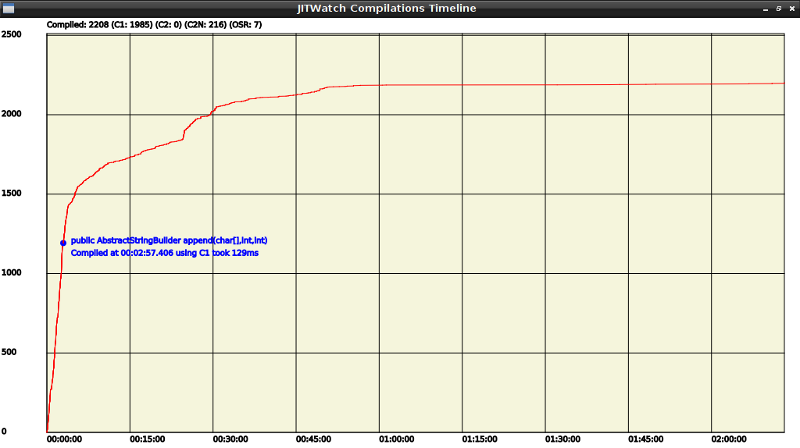
Chart of compilations over time. Selected method is shown.
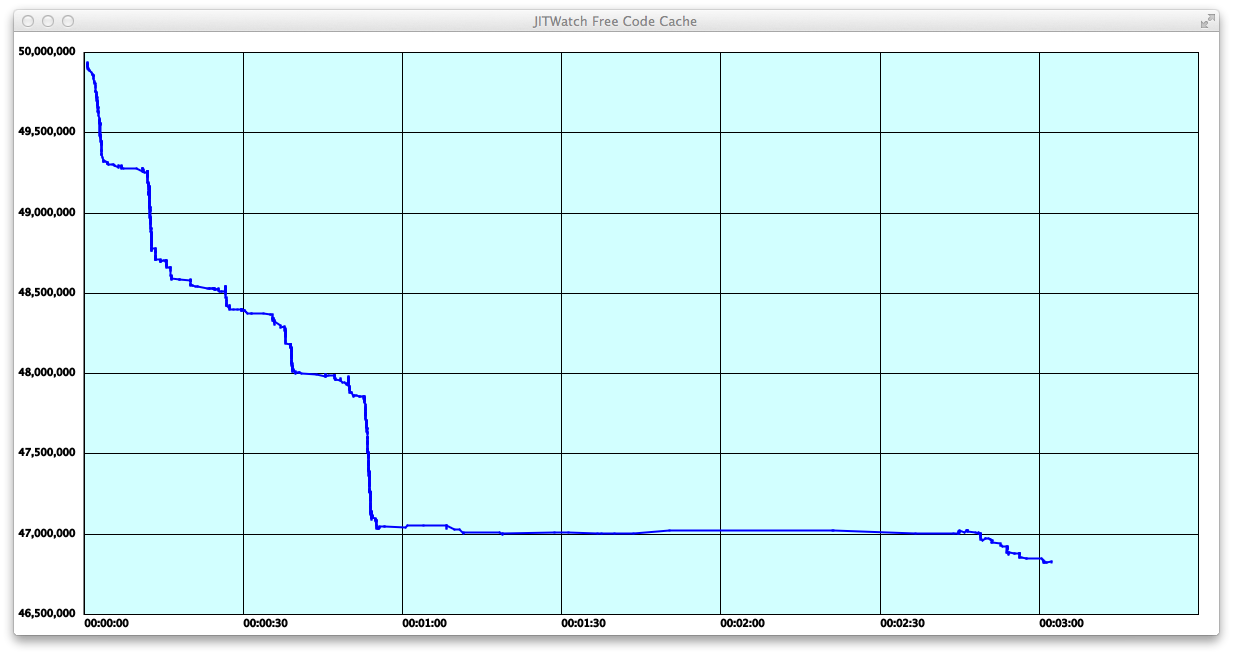
Code cache free space over time.
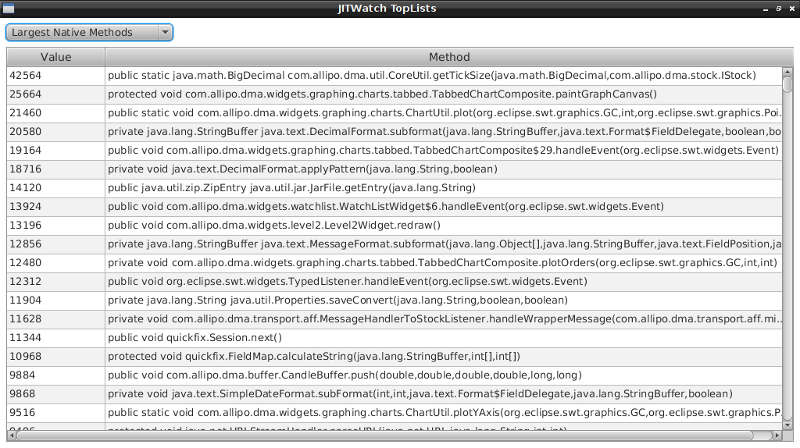
Toplists of largest native methods, highest bytecode count, longest compile time, etc.
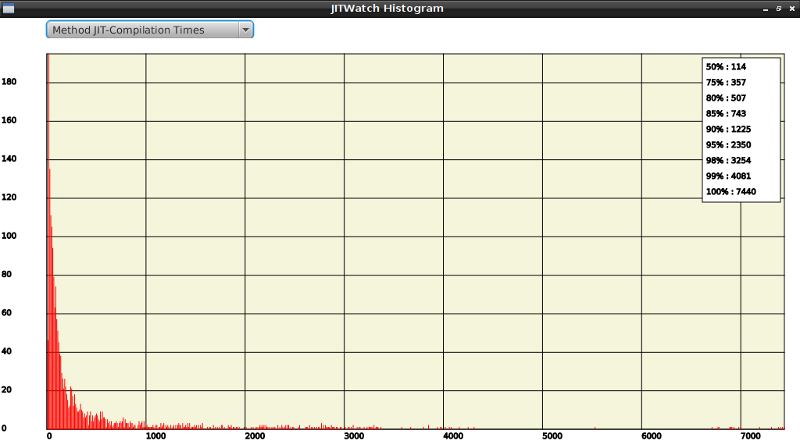
Histograms of compile times, method sizes, etc.
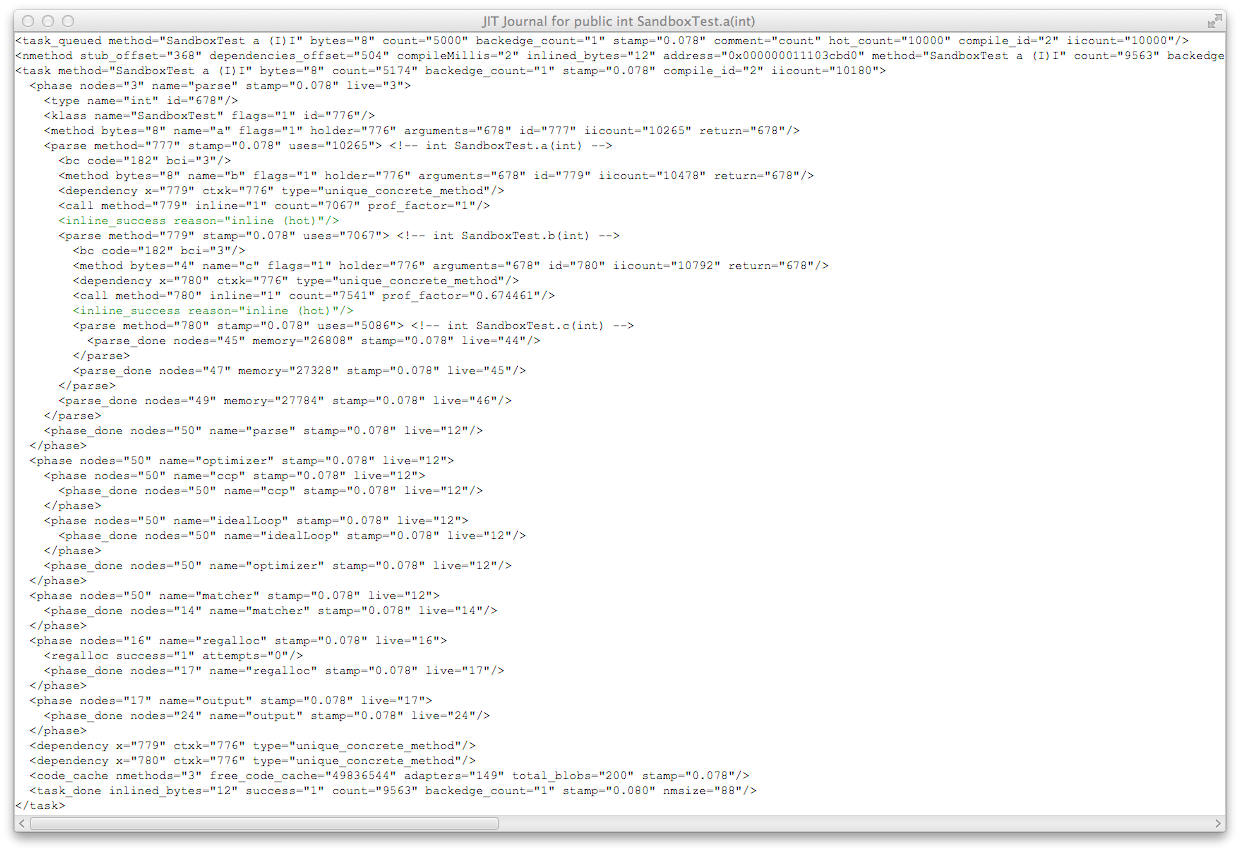
JIT Journal: Find all the log statements associated with a method.
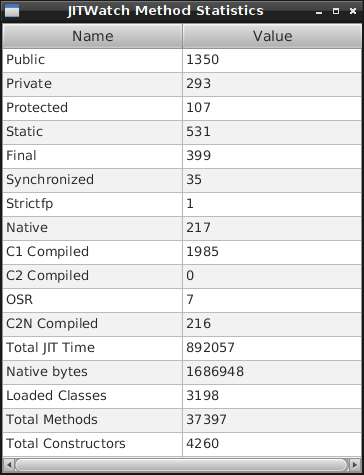
Statistics on JIT compilations made by HotSpot.
