-
Notifications
You must be signed in to change notification settings - Fork 120
Simulate SPPs
Torsten Sommer edited this page Nov 27, 2017
·
3 revisions
FMPy provides experimental support for SSP (System Structure and Parameterization), a standard currently developed as a Modelica Association Project.
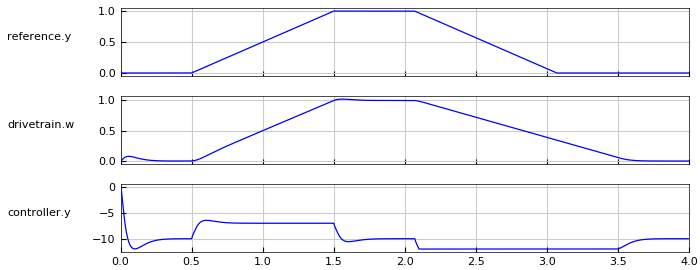
This example demonstrates how to simulate a system of three FMUs provided as an SSP file. The system consists of the PID_Controller example from the Modelica Standard Library exported as Reference.fmu, Controller.fmu and Drivetrain.fmu

The system is described by the SystemStructure.ssd
<?xml version="1.0" encoding="UTF-8" standalone="yes"?>
<SystemStructureDescription xmlns="http://www.pmsf.net/xsd/SystemStructureDescriptionDraft" version="Draft20170606" name="ControlledDrivetrain">
    <System name="ControlledDrivetrain">
        <Elements>
            <Component name="controller" source="resources/Controller.fmu" type="application/x-fmu-sharedlibrary">
                <Connectors>
                    <Connector name="u_s" kind="input"/>
                    <Connector name="u_m" kind="input"/>
                    <Connector name="y" kind="output"/>
                </Connectors>
            </Component>
            <Component name="drivetrain" source="resources/Drivetrain.fmu" type="application/x-fmu-sharedlibrary">
                <Connectors>
                    <Connector name="tau" kind="input"/>
                    <Connector name="w" kind="output"/>
                </Connectors>
            </Component>
            <Component name="reference" source="resources/Reference.fmu" type="application/x-fmu-sharedlibrary">
                <Connectors>
                    <Connector name="y" kind="output"/>
                </Connectors>
            </Component>
        </Elements>
        <Connections>
            <Connection startElement="reference" startConnector="y" endElement="controller" endConnector="u_s"/>
            <Connection startElement="drivetrain" startConnector="w" endElement="controller" endConnector="u_m"/>
            <Connection startElement="controller" startConnector="y" endElement="drivetrain" endConnector="tau"/>
        </Connections>
    </System>
</SystemStructureDescription>
On the command line change to a temporary directory and enter
python -m fmpy.ssp.examples.controlled_drivetrainto automatically download and simulate the ControlledDrivetrain.ssp and plot the results.
